Friday, October 13, 2017

The greater omentum is the largest of the two peritoneal folds. It consists of a double sheet of peritoneum, folded on itself so that it has four layers.
The two layers of the greater omentum descend from the greater curvature of the stomach and the beginning of the duodenum. They pass in front of the small intestines, sometimes as low as the pelvis, before turning on themselves, and ascending as far as the transverse colon, where they separate and enclose that part of the intestine.
These individual layers are easily seen in the young, but in the adult they are more or less inseparably blended.
The left border of the greater omentum is continuous with the gastrosplenic ligament; its right border extends as far as the beginning of the duodenum.
The greater omentum is usually thin, and has a perforated appearance. It contains some adipose tissue, which can accumulate considerably in obese people.


Reference

Ascites


CT is most sensitive to small amounts of fluid in the peritoneum which collects preferentially in the dependent regions, such as Morison pouch and the pelvis. The CT density of intraperitoneal fluid may give a clue to the underlying aetiology:
  • transudative ascites density should be approximate to that of water (-10 to +10 HU)
  • exudative ascites (density >5 HU)
  • haemoperitoneum density is higher still (~45 HU)
Of course, other intra- or extra-abdominal CT features may give further evidence to the origin of the ascites (e.g. features of heart failure, features of cirrhosis, peritoneal catheter in situ, etc).

May detect smaller volumes especially if it's adjacent to the diaphragm or anterior margin of the liver 3. Assessment of fluid type:
  • simple ascites is anechoic
  • exudative, haemorrhagic or neoplastic ascites contains floating debris
  • septations suggest an inflammatory or neoplastic cause and may be called a loculated ascites

Saturday, June 2, 2012

Twinkle artifact and bladder calcification

(a)
(b)
(c)


Edge artifact caused by bladder encrustation. (a) Transverse US image of the bladder (midline view) shows extensive bladder wall calcification (arrows). (b) Power Doppler US image demonstrates signal along the edges of the calcification. (c) Doppler spectrum fails to show any evidence of flow in the affected region.

Twinkle artifact and renal calculus

(a)
(b)


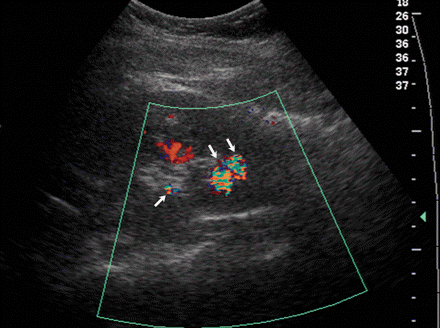
Twinkle artifact owing to renal calculi. (a) Longitudinal gray-scale US image shows a faintly echogenic region in the lower pole sinus but no definite renal stones. (b) Color Doppler US image depicts three calculi with twinkle artifact (arrows).

Twinkle artifact


Twinkle artifact behind a bladder calculus. (a) Longitudinal post-voiding US image of the bladder shows a hyperechoic, shadowing bladder calculus (arrow). (b) Transverse color Doppler US image shows twinkle artifact posterior to the stone. (c) Transverse power Doppler US image again shows the twinkle artifact. (d) Doppler spectrum shows noise.

To produce twinkle artifact, you should decrease RPF.

Saturday, February 18, 2012

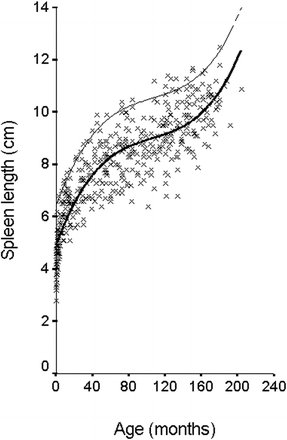
Spleen Length in Childhood with US: Normal Values Based on Age, Sex, and Somatometric Parameters


Scatterplot shows spleen length plotted against age. Regression curve (black line) and approximate 90% upper confidence limit (UCL [dashed line]) are also presented. × = individual values.


http://radiology.rsna.org/content/231/1/129/T1.expansion.html

Tuesday, January 17, 2012

PET in Differentiating Benign from Malignant Masses

More recently, PET has been suggested as a useful tool in the evaluation of the nonhyperfunctioning adrenal mass.

Although still preliminary, the results of multiple recent studies suggest that PET performed with fluorine-18 fluorodeoxyglucose (FDG) is highly accurate in differentiating benign from malignant lesions.

In general, malignant masses in the adrenal gland (and elsewhere) show increased uptake of FDG due to increased glucose utilization, but benign noninflammatory lesions show no evidence of increased FDG uptake (Figs).

Contrast-enhanced CT scan demonstrates a smooth-margin, low-attenuation right adrenal mass (arrow).

FDG PET scan shows normal activity in the kidneys (arrows) but no increasing activity in the right adrenal gland.

Nonenhanced CT scan demonstrates a right adrenal mass (arrow)

FDG-PET SPECT scan obtained at the same level shows increased activity in the right adrenal gland (arrow), a finding diagnostic of a metastasis.


Three recent studies demonstrated that FDG PET had 100% sensitivity and 80%–100% specificity for differentiating malignant from benign adrenal masses. If these results are corroborated, FDG PET could become part of the routine evaluation of the patient with a nonhyperfunctioning adrenal mass, especially since the study allows simultaneous whole-body imaging. PET may also be useful for localizing pheochromocytomas.

Monday, January 16, 2012

Summary

There has been a large amount of recent research discussing the evolving role of radiology in both detecting and characterizing abnormalities of the adrenal gland. 

The role of CT has continued to expand in both detection and characterization of an adrenal mass. 

For a suspected hyperfunctioning adrenal neoplasm, CT should be performed after the appropriate biochemical screening examinations have been performed.

To differentiate a benign adenoma from a metastasis in the oncology patient, nonenhanced CT should be performed and attenuation of the mass quantified. 

If the attenuation of the adrenal mass is 10 HU or less, the mass is an adenoma and the work-up can stop.

If the attenuation is over 10 HU, contrast-enhanced CT should be performed and washout calculated.

A washout of over 50% implies an adenoma.

If the mass remains indeterminate, MR imaging or adrenal biopsy should be performed. 

Finally, certain features can be used by the radiologist to establish a definitive diagnosis for an adrenal mass based on imaging findings alone. 


MR Imaging in Differentiating Benign from Malignant Masses

1- In general, metastases and carcinomas contain larger amounts of fluid than adenomas and thus appear bright on T2-weighted images. However, there is significant overlap in T1 and T2 signal intensity between adenomas and metastases, and thus signal intensity is not useful to reliably differentiate between them.

2- Enhancement patterns have also been investigated as a means of differentiating benign adrenal adenomas from metastases, and, similar to their appearance at CT, adenomas vigorously enhance and exhibit early washout of contrast material compared with metastases on MR images. Given the increased cost of MR imaging, CT is probably more cost effective to assess enhancement patterns.

3-  As stated earlier, intracellular lipid is high in most adrenal adenomas and low in metastases. Chemical shift imaging is an MR imaging technique used to detect lipid within an organ and is the most sensitive method for differentiating adenomas from metastases.

4-In out-of-phase images, the adenoma appears darker than on in-phase images (Fig)


T1-weighted in-phase MR image demonstrates a right adrenal mass (arrow).

T1-weighted out-of-phase MR image shows signal drop-off in the adrenal gland (arrow), which is diagnostic of an adenoma.


5- In adrenal masses that do not contain lipid (eg, metastases), there is no significant signal loss on out-of-phase images, and thus the signal intensity of the adrenal gland is the same on in-phase and out-of-phase images (Fig).

T1-weighted in-phase MR image demonstrates a left adrenal mass (arrow).


T1-weighted in-phase MR image demonstrates a left adrenal mass (arrow).

T1-weighted out-of-phase MR image shows no significant signal loss in the adrenal gland compared with that of the spleen. The mass is either a metastasis or atypical adenoma, and biopsy was recommended.

6-  When in-phase and out-of-phase images are compared, an internal standard is useful to visually quantify signal drop-off. In general, the liver is a less reliable internal standard because intrinsic liver disease (eg, steatosis, hemochromatosis) can cause variable hepatic signal intensity on in-phase and out-of-phase images (Fig). We find it useful to compare signal intensity of the adrenal gland with that of the spleen as the internal standard. It is also helpful for the technologists to use one prescan value for both in-phase and out-of-phase acquisitions, since variable prescan values can vary the signal intensity of the adrenal gland. Finally, it is important for the technologist to use the same window and level values on both in-phase and out-of-phase images. 


T1-weighted in-phase MR image demonstrates a right adrenal mass (arrow), which is isointense relative to the liver (L) and slightly higher in signal intensity than the spleen (S).

T1-weighted out-of-phase MR image shows signal drop-off in both the liver (due to steatosis) and the mass. The adrenal mass has clearly lost signal compared with the spleen on out-of-phase images, a finding that is diagnostic of an adenoma.
7- In summary, chemical shift MR imaging is the most sensitive technique for differentiating adenomas from metastases to the adrenal gland. When results of CT examinations are equivocal, MR imaging is the next imaging study of choice for characterizing adrenal lesions.

Contrast-enhanced CT.

1-The problem is that adenomas represent a heterogeneous population: Approximately 70% of them have intracellular lipid but 30% do not. Thus, although nonenhanced CT can be used to identify 70% of adenomas, it does not allow the 30% that do not contain lipid to be reliably differentiated from metastases. In addition, although nonenhanced CT is useful to differentiate adenomas from metastases, the majority of CT examinations in oncology patients use intravenous contrast material. 

2- Adenomas enhance rapidly with intravenous contrast media (either iodinated agents used at CT or gadolinium chelates used at MR imaging) and wash out the agent rapidly (Fig).


Nonenhanced CT scan shows a left adrenal adenoma (arrow), which has an attenuation of 4 HU.

On the dynamic enhanced phase image, the adrenal gland (arrow) enhances vigorously to 54 HU.


On the 10-minute delayed image, the attenuation of the left adrenal gland (arrow) is 23 HU (lower than that of the normal right adrenal gland, kidneys, and liver). There is greater than 50% washout between the dynamic phase of contrast enhancement and the 10-minute delay, which is diagnostic of an adenoma and confirms the finding on the nonenhanced CT scan. Quantitative region-of-interest measurements (in Hounsfield units) are important because degree of enhancement is difficult to quantify with the human eye.

3- Metastases also enhance vigorously with contrast material, but the washout of the agent is more prolonged than with adenomas (Fig). This difference in washout of contrast media has been exploited to further differentiate benign from malignant adrenal lesions. 

Nonenhanced CT scan demonstrates an enlarged left adrenal gland (arrow) with irregular margins and attenuation of 40 HU.

Dynamic enhanced CT scan of the adrenal gland (arrow) obtained 60 seconds after intravenous administration of contrast material demonstrates an increase in attenuation to 53 HU.

Ten-minute delayed image of the left adrenal gland (arrow) demonstrates persistent enhancement of the adrenal gland (56 HU). There is no significant washout of contrast media at 10 minutes, a finding consistent with an adrenal metastasis.

 4-Two features can be measured at delayed CT: the attenuation value of the adrenal gland and the washout of contrast media. A Hounsfield unit of less than approximately 30 at 10 minutes after injection has been shown to be diagnostic of a lipid-rich adenoma; however, most adenomas have an attenuation value higher than 30, and thus it is a specific but not a sensitive test. A more useful parameter is the percentage of washout of contrast material in which the attenuation of the adrenal gland at delayed CT is compared with its attenuation at dynamic CT. Loss of 50% of the attenuation value of the adrenal mass at delayed CT is specific for an adenoma; less than 50% washout is indicative of either a metastasis or an atypical adenoma. Percentage of washout is typically calculated by the following formula: (1 − delayed enhanced HU value/initial enhanced HU value) × 100. Quantitative region-of-interest measurements (in Hounsfield units) are important because degree of enhancement is difficult to quantify with the human eye.


5-It is important to stress that if a lesion in an oncology patient cannot be definitively called an adenoma after CT examination, the patient should undergo further evaluation with MR imaging or an adrenal biopsy to confirm a benign or malignant adrenal lesion. Thus, although an attenuation value of less than 10 HU at nonenhanced CT is diagnostic of an adenoma, an attenuation value of greater than 10 HU is not diagnostic of a metastasis. A lesion greater than 10 HU at nonenhanced CT may be either an adenoma or metastasis.

Role of non contrast CT imaging

1-Size of the lesion: Lesions greater than 4 cm in diameter tend to be either metastases or primary carcinoma.

2-Change in lesion size: Adenomas are slow growing and tends not to increase in size.

3-Shape of the gland: Adenomas tend to have smooth margins and homogenous texture while malignant lesions tend to have irregular margins and heterogenous texture.

All the above signs are considered to be non specific.

4-Adenomas have abundant intracytoplasmic fat in the adrenal cortex and thus have low attenuation at CT (Fig).


Typical nonenhanced CT findings of an adrenal adenoma in a 64-year-old man with no known malignancy. The left adrenal adenoma (arrow) has smooth margins, is well defined, and has a attenuation of 5 HU, all findings characteristic of an adenoma.

5- Conversely, metastases have little intracytoplasmic fat and thus do not have low attenuation at nonenhanced CT (Fig).


Typical nonenhanced helical CT findings of metastasis in a 76-year-old man with lung carcinoma. On the CT scan, the right adrenal gland (arrow) is enlarged, has irregular contours, and has an attenuation of 36 HU, all findings characteristic of metastasis. Adrenal masses with attenuation values over 10 HU at nonenhanced CT require further evaluation with either CT contrast material washout, chemical shift MR imaging, or adrenal biopsy.

6- To differentiate a benign adenoma from a metastasis in the oncology patient, nonenhanced CT should be performed and attenuation of the mass quantified. If the attenuation of the adrenal mass is 10 HU or less, the mass is an adenoma and the work-up can stop. If the attenuation is over 10 HU, contrast-enhanced CT should be performed and washout calculated.